Note
Go to the end to download the full example code.
ASM1: samples in the SO ramp manifold in phase space#
# Copyright (C) 2024 Juan Pablo Carbajal
# Copyright (C) 2024 Mariane Yvonne Schneider
#
# This program is free software; you can redistribute it and/or modify
# it under the terms of the GNU General Public License as published by
# the Free Software Foundation; either version 3 of the License, or
# (at your option) any later version.
#
# This program is distributed in the hope that it will be useful,
# but WITHOUT ANY WARRANTY; without even the implied warranty of
# MERCHANTABILITY or FITNESS FOR A PARTICULAR PURPOSE.  See the
# GNU General Public License for more details.
#
# You should have received a copy of the GNU General Public License
# along with this program. If not, see <http://www.gnu.org/licenses/>.

# Author: Juan Pablo Carbajal <ajuanpi@gmail.com>
# Author: Mariane Yvonne Schneider <myschneider@meiru.ch>

from pathlib import Path
import matplotlib.pyplot as plt
import pandas as pd
import seaborn as sns
from sympy import *


try:
    import dsafeatures
except ModuleNotFoundError:
    import sys
    import os

    sys.path.insert(0, os.path.abspath("../.."))

import dsafeatures.levelsample as ls
from dsafeatures.printing import *
from dsafeatures.odemodel import ODEModel

init_printing()

plt.style.use('figures.mplstyle')
Select model#
model = ODEModel.from_csv(name='ASM1')
Sample the ramp manifold#
max_O2 = 8.0         # WARNING: if changed delete pickle file
max_O2_inflow = 1e3  # WARNING: if changed delete pickle file
filepath = Path('example_asm1_SO_ramp_hypersurface.pkl')
if not filepath.exists():
    points, rng = ls.sample_ramp(model=model, file=filepath, npoints=1024,
                            max_O2_inflow=max_O2_inflow,
                            S_O2=(1e-9, max_O2),
                            append=False, show=False)
else:
    points = pd.read_pickle(filepath)
Elapsed time: 7.694 seconds (1011 points)
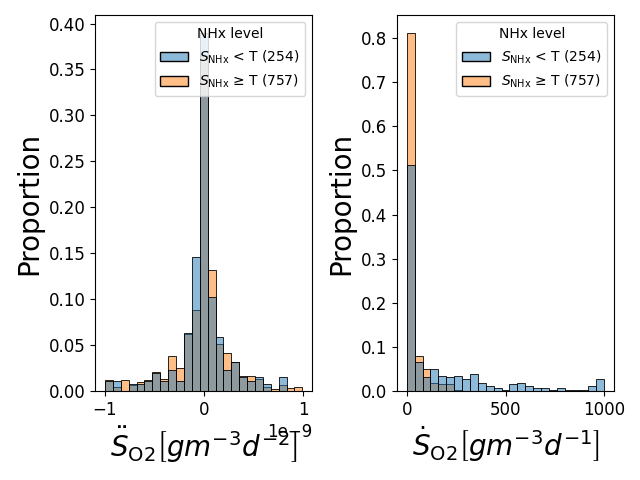
Plot samples on the ramp manifold#
nhx_T = 'NHx level'
nT = points[nhx_T].sum()
lbls = {True: fr"$S_\text{{NHx}}$ < T ({nT})", False: fr"$S_\text{{NHx}}$ ≥ T ({points.shape[0] - nT})"}
tmp_ = points.replace({nhx_T: lbls})

hue_order = [lbls[True], lbls[False]]
fd, fig = ls.plot_samples_ramp(points=tmp_, hue=nhx_T, hue_order=hue_order, show=False, plot_kws={'alpha': 0.1})

for ax_ in fd.axes[-1, :]:
    for ax in (ax_.xaxis, ax_.yaxis):
        lbl = ax.get_label()
        if lbl.get_text() == 'dotO2':
            s = r'$\dot{S}_\text{O2}$'
            lbl.set_text(s)
fig.tight_layout(pad=0.2)
fig.subplots_adjust(left=0.05, bottom=0.075, right=0.99, top=1.0)
for l in fd.legend.get_lines():
    l.set_markersize(16)
    l.set_alpha(1.0)

fd.legend.set_title('')

# Inset with regression and other coloring
n = len(points.columns) - 2
inset = fig.add_subplot(n, n, 3)
inset.set_position([0.55, 0.55, 0.29, 0.39])

Xa_lvl = r'$X_\text{a}$ level'
bins = [0, 150, 250, 1e6]
tmp_[Xa_lvl] = pd.cut(tmp_[r'$X_\text{a}$'], bins,
                          labels=[f"≤ {bins[1]}", f" [{bins[1]}, {bins[-2]}]", f"> {bins[-2]}"])

sns.kdeplot(tmp_, x='dotO2', y=r'$S_\text{NHx}$', hue=Xa_lvl, palette='tab10',
            fill=True, cut=0, levels=2, bw_adjust=1.5, ax=inset)
sns.scatterplot(tmp_, x='dotO2', y=r'$S_\text{NHx}$', marker='.', color='k',
                alpha=0.25, ax=inset, legend=False)
inset.axhline(1, c='r')

# # Regression plot
# args_ = dict(x='dotO2', y=r'$S_\text{NHx}$', ax=inset, marker='.')
# sns.regplot(points[points[nhx_T]], **args_)
# sns.regplot(points[~points[nhx_T]], **args_)

inset.set_xlabel(r'$\dot{S}_\text{O2} \left[g m^{-3} d^{-1}\right]$')
inset.set_ylabel(r'$S_\text{NHx} \left[g m^{-3}\right]$')
inset.set_ylim(-1e-2, inset.get_ylim()[1])
(-0.01, 4.999997967651565)
Plot the quality of the ramp conditions#
plt.show()
Total running time of the script: (0 minutes 23.083 seconds)
Estimated memory usage: 169 MB