Note
Go to the end to download the full example code.
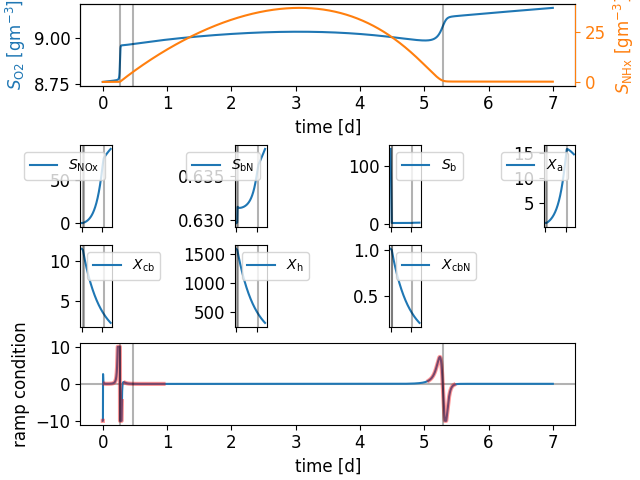
ASM1: true and false positive ramps#
# Copyright (C) 2024 Juan Pablo Carbajal
# Copyright (C) 2024 Mariane Yvonne Schneider
#
# This program is free software; you can redistribute it and/or modify
# it under the terms of the GNU General Public License as published by
# the Free Software Foundation; either version 3 of the License, or
# (at your option) any later version.
#
# This program is distributed in the hope that it will be useful,
# but WITHOUT ANY WARRANTY; without even the implied warranty of
# MERCHANTABILITY or FITNESS FOR A PARTICULAR PURPOSE.  See the
# GNU General Public License for more details.
#
# You should have received a copy of the GNU General Public License
# along with this program. If not, see <http://www.gnu.org/licenses/>.

# Author: Juan Pablo Carbajal <ajuanpi@gmail.com>
# Author: Mariane Yvonne Schneider <myschneider@meiru.ch>
import matplotlib.pyplot as plt
import numpy as np
from numpy import ma
from sympy import *

try:
    import dsafeatures
except ModuleNotFoundError:
    import sys
    import os

    sys.path.insert(0, os.path.abspath("../.."))

import dsafeatures.odemodel as m
import dsafeatures.symtools as st
import dsafeatures.signal_processing as sp

from dsafeatures.printing import *

init_printing()
Load the model#
asm = m.ODEModel.from_csv(name="ASM1")

# States
X = asm.states
# Process rates
r_sym, r = asm.rates, asm.rates_expr
Jr = r.jacobian(X)
# Matrix
M = asm.coef_matrix
# State derivative
dotX = st.dXdt(M, r)
# add areation
O2, idxO2 = asm.state_by_name("S_O2")
oxyflow = 500.0  # oxygen intake flow
aer = m.oxygen_PC(O2, max_inflow=oxyflow)
dotX[idxO2] += aer  #
# Inflection point curve
ipc = st.ddXdt(M[idxO2, :], Jr, dotX)[0] + aer.diff(O2) * dotX[idxO2]

# Parameter values
param_values = dict(asm.parameters(and_values=True).set_index("sympy").value)
param_values = {k: float(v.subs(param_values)) for k, v in param_values.items()}
replace parameter symbols with values
ipc_pv = ipc.subs(param_values)
ipc_states = sorted(tuple(x for x in X if ipc_pv.has(x)), key=str)

# same for ODE system
dotX_pv = dotX.subs(param_values)
Numerical simulation#
State values initial values
states_iv = asm.component["states"][["sympy", "initial_value"]].set_index("sympy").loc[list(X), "initial_value"]
# ignore all states not affecting the ODE,
states_iv[asm.state_by_symbol_name("S_b")[0]] = 128.94744
states_iv[asm.state_by_symbol_name("X_cb")[0]] = 11.48889
states_iv[asm.state_by_symbol_name("X_h")[0]] = 1585.25958
states_iv[asm.state_by_symbol_name("X_a")[0]] = 0.96299
states_iv[O2] = 8.76297
states_iv[asm.state_by_symbol_name("S_NOx")[0]] = 0.00235
NHx, idxNHx = asm.state_by_name("S_NHx")
states_iv[NHx] = 0.0065
states_iv[asm.state_by_symbol_name("S_bN")[0]] = 0.62963
cbN = asm.state_by_symbol_name("X_cbN")[0]
states_iv[cbN] = 1.01402
Integrate numerically#
Tend = 7
dotO2_min = 4e-2

ipc_np = lambdify([tuple(X)], ipc_pv, cse=True)

def ev(t, y):
    return ipc_np(y)
ev.terminal = 0
ev.direction = -1

sol, dX_np, J_np = sp.integrate_numer(dotX_pv, X, X_iv=states_iv, t_span=(0, Tend), max_step=1e-3,
                                      events=[ev])
other_states = [x for x in ipc_states if x not in (O2, NHx)] + [cbN]
fig = plt.figure(layout="constrained")
axd = fig.subplot_mosaic(
    [
        [O2] * 4,
        other_states[:4],
        other_states[4:] + ['.'],
        ['ipc'] * 4,
    ])

ax = axd[O2]
# add shared axis for NHx
ax.plot(t, y[idxO2])
clc1 = ax.get_lines()[-1].get_color()
ax.set_ylabel(latex(O2, mode="inline")+' [g$\mathrm{m}^{-3}$]', color=clc1, fontsize=12)
ax.set_xlabel("time [d]", fontsize=12)

axNHx = ax.twinx()
axNHx.plot(t, y[idxNHx], color='C1')
clc = axNHx.get_lines()[-1].get_color()
axNHx.set_ylabel(latex(NHx, mode="inline")+' [g$\mathrm{m}^{-3}$]', color=clc, fontsize=12)
axNHx.spines['right'].set_color(clc)
axNHx.tick_params(axis='y', colors=clc)

Xl_ = list(X)
for x in other_states:
    ax = axd[x]
    ax.plot(t, y[Xl_.index(x)], label=latex(x, mode="inline"))
    ax.legend()
    ax.set_xticklabels([])

trans = lambda x, n=0.3: np.sign(x) * np.minimum(np.abs(x), 10)
ax = axd['ipc']
ax.axhline(0.0, color='k', alpha=0.3)
ax.plot(t, trans(ipc_val))
ipc_ = ma.masked_where(dx_val <= 4e-2, ipc_val)
ax.plot(t, trans(ipc_), c='r', lw=3, alpha=0.4)

ax.set_xlabel("time [d]", fontsize=12)
ax.set_ylabel("ramp condition", fontsize=12)

# Add lines at ramps
for t_, y_ in zip(sol.t_events[0], sol.y_events[0]):
    if dX_np(y_)[idxO2] > dotO2_min:
        for ax in axd.values():
            ax.axvline(t_, color='k', alpha=0.3)

if False:  # DEBUG
    # Spline representation
    dx_s = sp.make_interp_spline(t, dx_val, k=3)
    ipc_s = dx_s.derivative()

    ax.plot(t, ipc_s(t), ':')
    ax_ = ax.twinx()
    ax_.plot(t, dx_val, label="symbolic")
    ax_.plot(t, dx_s(t), ':', label="numerical")
/builds/sbrml/dsa-signal-features/doc/examples/example_asm1_SO_ramps.py:137: SyntaxWarning: invalid escape sequence '\m'
  ax.set_ylabel(latex(O2, mode="inline")+' [g$\mathrm{m}^{-3}$]', color=clc1, fontsize=12)
/builds/sbrml/dsa-signal-features/doc/examples/example_asm1_SO_ramps.py:143: SyntaxWarning: invalid escape sequence '\m'
  axNHx.set_ylabel(latex(NHx, mode="inline")+' [g$\mathrm{m}^{-3}$]', color=clc, fontsize=12)
plt.show()
Total running time of the script: (0 minutes 6.281 seconds)
Estimated memory usage: 108 MB